Ch. 4
3 of 1 ·Charts That Nudge You
Chapter 4 · Numbers Tell Stories
Lesson 3 · Numbers in Context
Charts That Nudge You
Inspect axes, labels and missing context before trusting the shape.
Easy~25 minFree preview
Concept
A chart is an argument in visual form
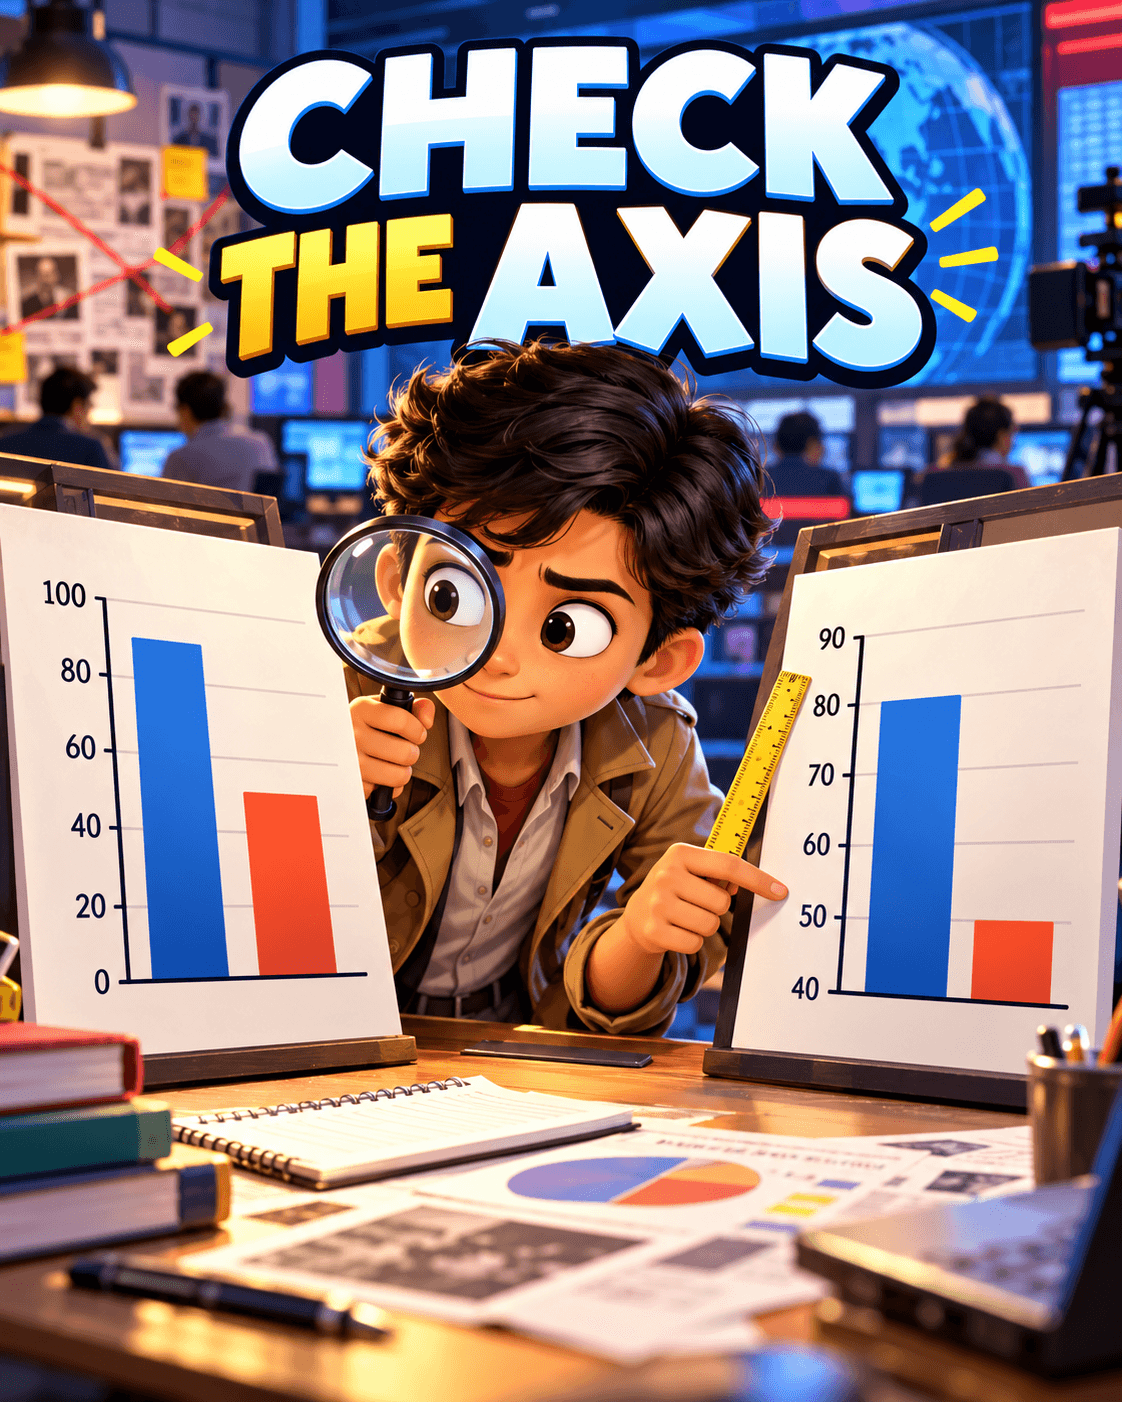 Click to zoomIllustration supporting A chart is an argument in visual form
Cropped axes can make small changes look enormous. Unequal intervals, missing labels and selective dates can quietly push a conclusion even when every plotted number is real.